

By Michael Sepe
Frequently, clients request a methodology for simulating long-term performance in a plastic material based on short-term testing. Accelerated testing protocols are well documented and frequently used to qualify products. They serve as the basis for the Relative Thermal Index ratings that are part of the Yellow Cards issued by Underwriter’s Laboratories. The method for developing this property consists of aging test specimens at various temperatures and periodically testing mechanical or electrical properties to assess the effects of this exposure on property retention. Over time, oxidation, which is presumed to be the mechanism associated with aging, causes a decline in these properties. When the properties have declined by a certain percentage relative to their values for an unexposed set of samples, failure is considered to have occurred. If the log of the time required to reach this failure point is plotted as a function of temperature, the data will fit reasonably well to a straight line and it can be extrapolated to time frames much longer than those of the actual tests. In the case of the relative thermal index, tests that run for between one month and one year are used to extrapolate to approximately seven years.
Looking for polymers?
Prospector has thousands of listing for polymers from global suppliers.
Search Polymers
The model used as the basis for this technique is known as the Arrhenius model and it has been around for a long time. It posits an exponential relationship between temperature and the rate at which properties decline, and it establishes an acceleration factor that is derived from the slope of the line relating these parameters. Generally, this acceleration factor is considered to be 2 for a change in temperature of 10oC. This leads to the rule of thumb that raising the temperature of an application environment will halve the useful life of a material and reducing the temperature by the same increment will double the lifetime. Because it is an exponential relationship, a temperature change of, for example, 30oC will produce a change of 23 and this pattern can theoretically be extended indefinitely. Figure 1 demonstrates this principle by presenting experimental data on the time required to induce oxidation in a polyethylene material at three different temperatures.
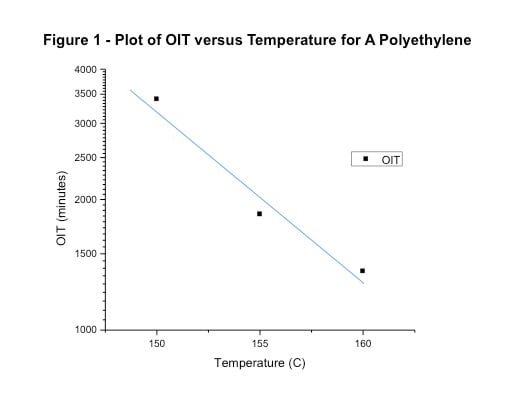
In these experiments the actual ratio between the oxidation induction time and the temperature gives a slope that yields an acceleration factor of 2.5 for each change of 10oC. This illustrates one of the uncertainties associated with this model and it is the reason that each material should be evaluated on its own merits rather than assuming some generic value. While the value of 2 for the acceleration factor associated with oxidation is a good first approximation, repeated experimentation over a long history has shown that this value can vary between 1.8 and 2.5. If the actual experimental results are extrapolated across a significant temperature range, the differences in the predicted lifetime can change substantially. As an example, the data in Figure 1 extended to 70oC will predict a time to failure of 86,600 hours, or nearly ten years, while employing the assumed acceleration factor of 2 provides a prediction of only 14,530 hours, or approximately twenty months. Many formal protocols that employ this methodology, use values somewhat higher than 2. The obvious advantage is that a shorter test will produce a longer term prediction. The medical device industry uses an acceleration factor of 2.3. This produces a general rule of enviable simplicity that one month at 55oC is equivalent to one year at 25oC (2.33=12.167).
But those who have performed a lot of these tests acknowledge that often the data is not so well behaved. And the problems go beyond an uncertainty about the correct acceleration factor. The root of the problem lies in the principle that when temperature is elevated, multiple mechanisms can be accelerated. These mechanisms all have an influence on the properties that are being measured and most of them are accelerated to a much more significant degree than oxidation. And while most of them cause properties to decline, some of them can actually improve performance, at least during the initial stages of the tests.
The mechanisms that enter into the experiments are governed by the nature of the material being tested. For example, an elastomer that incorporates a plasticizer will exhibit plasticizer migration and the rate of this migration is a function of temperature. Recently, we were asked to compare the properties of an EPDM product that had been recently manufactured and was suspected of being defective to samples of the same product that had been produced ten years earlier and were used as the standard for good parts. It quickly became evident during our testing that the composition of the two sets of samples was not the same and that the changes in composition could be attributed in part to plasticizer loss. These parts had been in storage at room temperature. But an accelerated test plan designed to predict long-term aging would certainly have driven the plasticizer out at a faster rate. If the property changes observed during accelerated testing are attributed solely to aging, and if the acceleration factor for plasticizer migration is different from that of oxidation, then the model will be skewed.
This actually happens in the world of medical devices. Many parts used in these devices are molded from rigid, amorphous thermoplastics. One mechanism that is known to occur in these types of materials is physical aging. Physical aging increases strength and stiffness but reduces ductility. The process occurs at a rate that is determined by the proximity of the exposure temperature to the glass transition temperature (Tg) of the polymer, Since the protocol for accelerated testing of medical devices calls for an elevated temperature of 55oC to simulate the long-term behavior at 25oC, amorphous polymers with high Tg’s such as polycarbonate and polysulfone may not experience a significant acceleration in physical aging across this temperature range. However, amorphous PET polyester, with a Tg of only 80oC, exhibits a considerable change in the rate of physical aging. Studies performed by suppliers of these materials and augmented by our own evaluations show that the acceleration factor for physical aging in amorphous PET is nearly 10 as opposed to the value of 2-2.5 used for oxidation. In other words, the effects of more rapid physical aging dwarf the effects of oxidation. Using an acceleration factor of 10 results in an equivalence of one month at 55oC translating to over 83 years at room temperature! Yet the mechanical property changes produced by the two mechanisms are often indistinguishable, especially in the area of toughness.
In semi-crystalline materials the structural rearrangement that produces analogous effects is residual crystallization and in crosslinked materials the mechanism is residual crosslinking, processes that can occur when the exposure temperature exceeds the Tg of the polymer. Accelerated aging protocols often advise against using temperatures above a certain upper limit to prevent interference from these types of mechanisms. In medical devices this upper temperature limit is prescribed as 60oC. But several semi-crystalline polymers have Tg’s below 60oC, including polyethylene and polypropylene. It is relatively simple to demonstrate that residual crystallization occurs more rapidly in these materials at 60oC than at room temperature. But here again, if it is assumed that all of the observed property changes in a material are due to oxidation, these tests will draw erroneous conclusions regarding the fitness-for-use of a particular material.
If a material is under load, a new set of considerations arise associated with creep and stress relaxation. There are well-established protocols for predicting long-term behavior under load using short-term tests that employ higher temperatures. But the acceleration factors associated with these mechanisms are dependent upon the specific material being tested as well as the temperature range over which the tests are being performed. Tests performed at temperatures in the vicinity of the glass transition region will produce acceleration factors that are much higher than those conducted over temperature ranges where the load-bearing properties of the material are relatively stable. Studies have shown that the acceleration factor for creep for a material whose properties are stable with temperature is actually in good agreement with the traditional values used for oxidation, between 2 and 2.5. But for materials that are used near their Tg these factors increase to between 5 and 6. This has been found to apply to both amorphous and semi-crystalline thermoplastics and occurs even when significant levels of reinforcement are part of the compound.
The complexity of this problem becomes magnified when assemblies made up of several different polymers are evaluated in a single product. This is demonstrated by an actual study performed recently on kits that contained components made of amorphous PET, polycarbonate, flexible PVC, and high-impact polystyrene. Some of these kits had been exposed to the accelerated aging protocol of 55oC while others were maintained for a much longer period of time at room temperature. The assemblies exposed to the higher temperature exhibited a failure of the high-impact polystyrene shell that served as the packaging for the kit components. No such failures were observed in the kits stored at room temperature.
Analysis showed that the cause of the failure was due to migration of plasticizer from the PVC tubing into the polystyrene tray causing chemical attack of the polystyrene. The elevated temperature of the accelerated test protocol had increased the rate of plasticizer migration. It was also determined that the particular type of plasticizer used in the PVC tubing was more susceptible to this migration than an alternate plasticizer that was also used in another PVC tubing that was part of the product. In addition, high-energy radiation sterilization performed on the product prior to the accelerated aging tests had created a vulnerability in this particular type of PVC tubing that made it more susceptible to plasticizer migration than in the pre-sterilized state.
Further studies revealed that the polystyrene exposed to the accelerated test protocol had also undergone considerable physical aging that had not occurred in the parts stored at room temperature. In addition, the butadiene rubber that makes up the impact modifier in the polystyrene, exhibited a degree of crosslinking that had not occurred in the parts stored at room temperature. This shows how dynamic the condition of different polymers can be during accelerated testing even when the temperature increases appear to be relatively small.
Accelerated test protocols are very attractive as a method for decreasing the time required to qualify a product. For this reason they will continue to be employed and new protocols will continue to be developed. But if they are to provide reliable results, a lot of work remains to be done to understand the kinetics of each of the applicable mechanisms, determine when they must be considered, and develop methods that allow for an accurate assessment of how they interact.
View Michael Sepe’s webinar on-demand!
Based on this article, Mr. Sepe presented a webinar, “The Problem of Confounded Mechanisms in Accelerated Testing Protocols,” which outlined some of the potential interferences, illustrated the problems that can result in attempting to model long-term behavior based on short-term responses, and proposed some possible solutions to these problems.
View Now
About the Author:
 Michael Sepe has worked in the plastics industry since 1975 in a variety of roles involving both manufacturing and research and development. He is an independent consultant based in Arizona with clients throughout North America, Europe, and Asia. He assists clients with material selection, designing for manufacturability, process optimization, troubleshooting, and failure analysis.
He has presented over 30 ANTEC papers, has written several book chapters on the testing of plastic materials, and has authored a database handbook titled Dynamic Mechanical Analysis for Plastics Engineering. He authors a monthly column for Plastics Technology titled “Materials Know How” and previously wrote a monthly article for Injection Molding Magazine for fifteen years on the practical aspects of using testing techniques to solve manufacturing problems. He teaches a variety of short courses for the University of Akron and gives in-plant seminars to designers, engineers, and processors on material selection and testing, failure analysis and prevention, processing, and troubleshooting.
The views, opinions and technical analyses presented here are those of the author or advertiser, and are not necessarily those of ULProspector.com or UL Solutions. The appearance of this content in the UL Prospector Knowledge Center does not constitute an endorsement by UL Solutions or its affiliates.
All content is subject to copyright and may not be reproduced without prior authorization from UL Solutions or the content author.
The content has been made available for informational and educational purposes only. While the editors of this site may verify the accuracy of its content from time to time, we assume no responsibility for errors made by the author, editorial staff or any other contributor.
UL Solutions does not make any representations or warranties with respect to the accuracy, applicability, fitness or completeness of the content. UL Solutions does not warrant the performance, effectiveness or applicability of sites listed or linked to in any content.
Activation energy for PE aging reactions is strongly dependent on the pass/fail criteria one chooses. An Arrhenius plot of accelerated aging testing on PE gives an Ea of 50kJ/mol with OIT measurements. However plastic pipes behave in a ductile manner and perform for a long time after OIT approached zero minutes.
Brittle failure times of PE pipes in hot water circulation testing provide an Ea of 90 kJ/mol (Vogt et al., Hessel et al. http://www.hessel-ingtech.de) up to 110kJ/mol calculated from brittle failures in ISO 9080 hydrostatic pressure testing.
These results correlate to real failures in the field.
As illustrated by Martin Chandler, exact knowledge of Ea is very important to calculate/estimate a realistic acceleration factor for accelerated aging testing at increased temperatures.
A wise choice of pass/fail criteria for a test setup is the basis of realistic Ea calculations for a specific product and its application conditions. Activation Energy values are only valuable, when test conditions and pass/fail criteria are known.
A useful and important article. The pipe industry has a lot of history in accelerated testing especially with polyethylene under load. .. involves such things as tie molecules. cross-linking during extrusion, and “knees” in the stress-time curves. Theory is needed, real data and experience are needed and the best results come from a combination of all these..
Just a comment about figure 1, should the x-axis (abscissa) have the units of degrees Fahrenheit? Polyethylene will start melting around 80 degrees C, while this graph starts around 150 deg., where most plastics will be soft or molten.